_R&D_ii____
DISRPTN
[prototyping ongoing...]
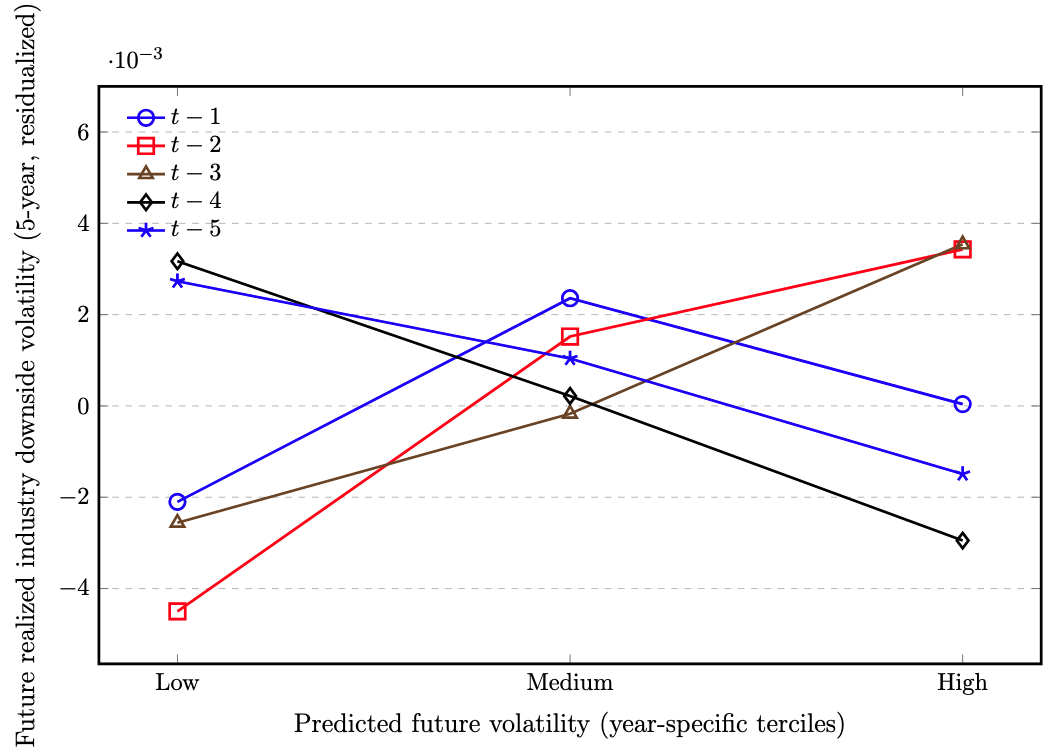
Figure. Predicted future volatility (terciles within year) and future realized industry downside volatility (5-year, adjusted), plotted across lags.
Lines correspond to t-1 through t-5.
Notes.
The outcome is future realized industry downside volatility measured over a 5-year forward window, constructed as the industry-year average of the square root of the semivariance of negative log revenue growth.
Historical volatility is measured analogously over the prior 5-year window.
To align with the baseline regression framework, all series are residualized prior to binning: future realized industry downside volatility is regressed on historical volatility with industry and year fixed effects,
and each lag of predicted future volatility (t-1 to t-5) is separately regressed on historical volatility with the same fixed effects.
Residuals therefore isolate within-industry, over-time variation net of persistence and common shocks.
For each lag, residualized predicted future volatility is sorted into year-specific terciles (Low/Medium/High) and the figure plots the mean residualized future realized industry downside volatility within each tercile.
Standard errors in the underlying regressions are clustered at the industry level.
THESIS
Entrepreneurs face the future first. When their option-implied risk rises, it can be a forward-looking signal that the industry’s downside is becoming more turbulent. In the same way markets embed expectations in prices, entrepreneurial implied volatility can embed expectations in real activity. When that signal intensifies, industries may be closer to a period where adverse outcomes become more dispersed, more frequent, and more consequential.
MODEL (1) — INDUSTRY REALIZED VOLATILITY (DOWNSIDE), 5-YEAR AHEAD
| Variable | Downside |
|---|---|
| (1) | |
| Implied volatility, t | 0.0053 |
| (s.e.) | (0.0089) |
| Implied volatility, t−1 | 0.0186* |
| (s.e.) | (0.0100) |
| Implied volatility, t−2 | 0.0278*** |
| (s.e.) | (0.0101) |
| Implied volatility, t−3 | 0.0333*** |
| (s.e.) | (0.0112) |
| Implied volatility, t−4 | 0.0136 |
| (s.e.) | (0.0110) |
| Implied volatility, t−5 | 0.0056 |
| (s.e.) | (0.0064) |
| Past realized volatility | 0.216** |
| (s.e.) | (0.0862) |
| Observations | 1,947 |
| $R^2$ | 0.777 |
| Industry FE | Yes |
| Year FE | Yes |
Table Notes.
Column (3) reports an OLS regression of 5-year-ahead realized industry downside volatility on contemporaneous and lagged implied volatility.
The specification includes historical (lagged) realized volatility, industry fixed effects, and year fixed effects.
Standard errors clustered at the industry level are reported in parentheses.
* p<0.10, ** p<0.05, *** p<0.01.